Free, high-quality commentary on Toronto issues! Now that the Globe and The National Post are charging for the privilege of reading their editorials.
Thursday, October 28, 2004
TTC blows away a cool $677 million
What I hope will be clear from the following graphs is that the STM has made great strides in efficiency over the last decade: operating costs per passenger have risen at a rate less than general inflation. During the same period, the TTC's cost per passenger have risen faster than inflation.
The first graph shows the per passenger operarting costs of the TTC and the STM. The blue line (in the middle) shows what the TTC's operating costs would have been had they attained the same ratio of productivity improvment (on a per passnger basis) as the STM over that period.
The second graph shows how much the TTC would have saved by attaining the STM's level of improvment - by year. This distiguishes between the initial cost difference ($1.73 vs $1.63) and the relative change during the decade.
The 3rd graph shows the cumulative impact. From 1994-2003, had the TTC achieved the same level of performacnce as the STM, Toronto and Torontians would have saved about $670 million!
The real degradation in the TTC's performance shows in 2000 and onwards. Was there perhaps a management change around that time? (Yes there was.)
Comparison of Costs per Passenger
TheStar.com - Suburban sprawl hits green wall
From the reports, the restrictions on new development leave a supply of land available for new homes and business for a number of years. "How many years" appears to be the question of debate. Regardless, the market will begin to factor in impending shortage of land quite quickly. The already high price of single family homes will see an additional upward boost quite quickly - as the land will fetch a premium.
The real problem - a few years down the road - will be the impact on the GTA's ability to attract and retain head office operations. The location of a company's head-office must be attractive to mid-level and senior professionals - who will continue to demand affordable dwellings suitable for their families - including chidren. A loft conversion at King and Jarvis will not cut it.
Companies will decide either the pay a wage premium for locating in the GTA - or pack and and move to Calgary or Montreal. Companies seeking industrial sites will move further afield: - up the escarpment to London, Guelph and Sarnia.
Tuesday, October 26, 2004
Toronto Sun Columnist: Sue-Ann Levy - It's never 'enough'
Personally, those MPP's expecting a thank-you from our mayor and council should note that they no-one in this group has ever said thank-you for the $150 million or so a year Toronto receives from the 905-belt property owners under the GTA social services pooling arrangement.
Monday, October 25, 2004
TheStar.com - Mayor's strategy could backfire
I enjoy James' columns. Despite shackles that tie him to his newpaper's party line of 'hear no evil, see no evil' on the City of Toronto's and the TTC's spendthrift ways - at least he is realistic enough to grasp that there are limits to what the Province will be willing to listen to.
The McGuinty regime is going to be in tough trying to temper the demands of unions on its own negotiating front. Meanwhile, Mayor Miller and his cabal have already shot themselves in the foot by granting generous increases to the firefighters - 3.5% a year for three years PLUS 'recognition pay' bumps based on seniority that push the average increase to at least 5% a year.
(Did we have aproblem recognizing our firefighters?)
Our MPPs may not be the swiftest - but they will surely recognize that most of the gas tax money granted to the the City will end up in CUPE and other union members pay packets. I hope Miller ratchets up the rhetoric even more. This might spark the McGunity crew into finding the nerve to make a public issue of Toronto's spendthrift ways. Could this be step one towards the long path to fiscal sanity in this city? (I can be such an optimist at times!)
Friday, October 22, 2004
Christopher Hume babbles
TheStar.com - Toronto's poverty was no accident
This has just about all of the features and arguments from articles and editorials - from The Star and The Globe and Mail - over the last few years.
Toronto is short-changed on taxes:
The $9 billion in net outflow has been bandied about frequently. Undoubtedly, Toronto citizens pay more in taxes than we get back in services and transfers. What seems to escape the attention of those who use this figure is that this is a direct result of: 1. High-marginal tax rates
AND 2. Equalization payments between the provinces . In fact, the net outflow per capita from Toronto residents pales in comparison to the net outflow from Toronto's neighbours in the 905 region. Per figures calculated by Mark Mullins of the Fraser Institute:
http://www.fraserinstitute.ca/admin/books/files/sharethewealth0512.pdf
Net outflow per householf byCounty/Area
Peel: ..........$13,918
Waterloo: .$10,891
Durham ....$10,861
Wellington: $10,034
Toronto: .....$9,497
Ontario average: $7,037
So yes - Toronto is shortchanged - but others are shortchanged by a much larger amount. Toronto is actually closer to the lower Ontario average than it is to the higher weighted average of the 905 communities. Yet 905 communities aren't crying poverty in the way Toronto is.
Mix and mismatch figures
Hume seemlessly executes the mix-and-mismatch slight of hand so typical of the 'new deal for cities' ranters. The figures on job growth are for the GTA - including Toronto and its 905 belt. The new-dealers like to tout Toronto as the engine of the Canadian economy. "Toronto" as the GTA does house the most important engine of the Canadian economy. However, "Toronto" as the city itself is the non-functioning cylinder that is dragging down the GTA's performance.
New-dealers like to include the 905 part of the GTA when touting how important the area is. However, when it comes to doling out $$$, they publicly scoff at funding projects in the 905 belt. In fact TTC chair Howard Moscoe has publicly derided funding York Region's busway-based project - calling the YRT a 'Mickey Mouse transit system' .
Blame the Harrisites
Hume and his fellow lefties at The Star can't pass up an opportinuty to excoriate former Ontario Premier Mike Harris. However, the figures on the economy and employment show that the damage was actually at the hands of fell0w-traveller Bob Rae and his NDP government. Rae's high-tax, high-regulation policies had Ontario's economy at death's door. Worst hit was Toronto - which lost over 150,000 jobs during the gloom of the Rae years.
Tuesday, October 19, 2004
Details of St. Clair W. ROW Decision
Policy and Finance Committee Report 7, Clause 1
A few comments:
A recommended read - I would highly recommend reading the document. It is the product of our local democracy - for better of for worse - and will give you a more accurate view of the whole project than reading snippets in the newspapers.
Amendments explained (sort of) - The Star's report after the council vote referred to amendment with respect to:
a. The maintenance of parking spaces during the project AND
b. The establishment of bicycle lanes
It is not clear what binding force these have. The amendment on parking appears firmer - as the text covers specific measures and financing. The status of bicylce lanes is not as clear. In this case, there is only a request to study using narrower lanes (as on Queen St. W).
The benefits of participating - A number of elements in the amendment/decision do reflect some of the concerns and ideas that I raised in emails with committee members and in my deputation:
a. The TTC is being asked to report on the cost of replacing the aging streetcar fleet with respect to the 25 life span of the report.
This is an issue I raised in my deputation to the committees. Within the 25 -year horizon, the CLRVs will first need to be rebuilt ($1.1 million per CLRV between 2008-2012), and then replaced 10 or so years after that (estimate of $3 million). For 22 CLRVs, this works out to $90.2 million - enough to purchase 150 or so buses. The math just doesn't work - so the TTC suppressed it.
The purpose of this amendment is not clear. The estimated costs for rebuilding and replacing these units are well-known. The process should have mandated a full life-cycle costing of each alternative. In a private business, heads would be rolling on the basis of such an omission.
b. The TTC is being asked to consider giving up their short-turn loops to help defray the loss of parking.
This is something I suggested to Councillor Mihevc - and was raised in at least one other deputation. To me, this is a proof-of-the-pudding question. If the TTC thinks that the ROW will improve service reliability so much - then they should have voluntarily divested themselves of these loops, as they should no longer need them.
Monday, October 18, 2004
Green bin jitters
However, the history of recycling programs has seen so many cases where dutiful citizens have been duped into spending chunks of free time separating their household waste - only to have the different streams recombined in a landfill due to a lack of market. Granted that the markets may develop in the long run - but in the long run we are all dead.
In the case of Toronto's green-bins, although there is a market for compost, there is not a infinite market. The market may be able to handle the amounts generated by Guelph - which instituted the wet-dry system a number of years ago. Can it absorb the quantities that will now be produced from Toronto? I'm all the more skeptical given that the city has been trucking sewage sludge to our aforementioned friends in the State of Michigan. This was supposed to have been peletized into fertilizer - a scheme for now derailed by a fire at the plant. This fact was kept under a fairly tight wrap until the last few weeks. I'll soon be checking the City's website to see if I can find actual statistics on the reduction in the 401 trash express.
If there is a shortage of compost, manure etc., it doesn't seem reflected in the prices of these. There are surely limits on how much fertilizer can be used by the agricultural sector. What will happen when the market tips into oversupply?
(If it is not already.)
Well - some of my neighbours already have their bins out at curbside. Given the burgeoning racoon population in my neighbourhood, I'm leaving this secured upright on my front porch until the morning. No racoon has yet attacked it. Perhaps this is because they have been so busy trying to empty my bird feeder.
Monday, October 11, 2004
Newsflash: The Star Discovers TO's job problem
Where have all the jobs gone?
Although this is hardly news - as the national press picked this up a while ago - it's good to see The Star perhaps a stepping away from complete denial over this trend. The article certainly suggests that high taxes on commercial and industrial estate are a large factor in the job exodus. While this should be obvious to anyone in contact with planet earth, the LL (loonie-left) in this city are in denial mode - as a result either of self-delusion, or an imposed muzzling. For an example, see Councilor Brian Ashton's remarks as reported in a column by Sue-Ann Levy of The Toronto Sun:
Toronto could be a tough sell - Mayor leads trade mission to Europe
who reports:
When I pointed out to Ashton that the city's high property taxes are driving businesses to the GTA and council is doing nothing to contain costs, he said that's "absolute nonsense" ..
The only problem I have with the article is that it reports only the job loss since 2000. It's true that the job loss since 2000 has been about 38,000 - a drop from roughly 1.29 million in 2000 to 1.25 in 2003.
What no-one has reported is that the job-loss from 1989 to 2003 has been about 110,000- from roughly 1.36 million to the most rcent survey at 1.25 million. This is not all the bad news - however. The city also surveys the split between full-time and part-time jobs. The numbers reported in article are the total of part and full time - without weighting.
The City's own reports show a large increase in the proportion of part-time employees in this overall numbers:
Toronto Employment Survey 2003
Assuming (generously) a part-time job is 0.6 of a full time job, the real job loss is roughly 150,000 FTEs (full-time equivalents).
(I guess Councillor Ashton still has these reports in his in-basket - perhaps when he returns from the junket to Europe, he might get around to reading them.)
Friday, October 08, 2004
TTC Streetcars - Part IIa - The capacity vanishes
Part I of this series reveals that TTC streetcars are not achieving their promised capacity advantage - and that the inexpensive, lowly bus is providing equal or even better performance.
In this installment, I begin to examine why the larger, more expensive-to- operate, and more capital intensive streetcar is not living up to its billing - (surely the Doug Wickenheiser of the transit world).
Some remarks on capacity
One needs to take care when using the term "capacity" in relation to elements of a public transportation system. There are many terms of capacity:
For the vehicles themselves:
Seating capacity
Planning capacity
Natural Capacity
Crush load capacity
For a given route:
Capacity over a whole route for a day
Peak capacity of a route in one direction
Rush hour capacity over the rush hour period
Those in the transit ‘business’ tend to use capacity arguments to bolster cases for their preferred technology. There is a long history of internecine strife between rail advocates and bus advocates - who use wildly differing assumptions on factors such as vehicle capacity and minimum headway (time between vehicles) to promote their favourites and dismiss the alternatives. These arguments are usually theoretical. Here we avoid the crossfire in this pseudo-religious war by using:
1. Real data - i.e. these are actual numbers from operating transit services
2. The boardings/service hour measure (rather than the intermediate measures listed above)
3. Some personal observations and measurements
So let us examine where the capacity vanishes:
1. Spare factors
A vehicle can even be available for one of those service hours when it is not undergoing maintenance. TTC streetcars require over 2.5 times the vehicle maintenance as do its buses. This means more time in the shop - and less time picking up, moving and dropping off passengers. Per the 2003 IBI Report ("Review of TTC Key Performance Measures - Feb 18th 2003), the spare ratios are (2001 figures):
Streetcar: 29.2 % VS Bus: 13.8 %
While the streetcar figure may reflect some inherent unused slack (i.e. truly spare), an analysis of the TTC routes by streetcar advocate Steve Munro ("Transit’s Lost Decade" - undated ca. 2002) shows that, based on 2001 figures, the TTC deployed only 189 streetcars out of 248 during the a.m. peak - or only 76.2% of the fleet. This suggests a ‘peak spare factor’ for streetcars of 23.8%. Given that streetcar vehicle maintenance requirements are so intense, a reasonable inference is that this results in the roughly 10% disadvantage (23.8% vs. 13.8%). [Note - the spare factor varies - based on the number of streetcars that are undergoing heavier maintenance procedures in the Harvey Shop. CLRVs appear to have higher normal availability - but require periodic replacement of underfloor piping, which is not the case for ALRVs.]
In effect, in comparing 100 CLRVs and ‘equivalent’ buses really means requires comparing 110 CLRVs vs. 100 buses.
2. Streetcar service cancellations
Streetcar service requires not only vehicles, it requires track. In cases, streetcars can operate during track maintenance. In many, however, the TTC must substitute use buses instead. This occurs during large track replacement projects - such as the current work on the 506 route, spot repairs, and non-TTC street maintenance that might preclude use of the tracks.
The frequency with whch the TTC must run buses in lieu of streetcars varies between years. Some years see more construction activity. Depending on the location of the construction, the TTC may:
- run buses on part/whole of the route (the latter forcing lucky passengers into yet one one transfer) - OR -
- divert streetcars and run shuttle buses to serve local residents (e.g. during the reconstruction of the Queen St. bridge over the Don River a couple of summers back.)
Regardless, the TTC requires a certain number of buses in order to continue to serve customers dependent on streetcar routes. The TTC Chief General Manager’s report (at least up until 2001) has figures on the number of service cancellations. For 2001, the numbers were:
Targeted cancellations: 140 Actual cancellations: 613
Now, the TTC has 11 streetcar routes - some of which are more heavily used than others. For example, the cancellation of the 506 during the ongoing construction requires many more buses than say for cancellations on the 502/503 routes that go up Kingston Road.
Taking a conservative approach to calculating the number of buses required to operate the streetcar system, we take the targeted number (140) divided by the number of routes (11). This gives 12.7 cancellations for each route annually - or 3.4% of the time. (One could argue that the TTC's target is unrealistic. Perhaps - but they are likely able to somewhat catch up on heavy vehicle maintenance on during the large construction projects. In other words, some of the track maintenance activity helps alleviate the spare factor problem.)
So, based on #1, we have 110 CLRVs being compared to 100 buses. To account for the needed 3.4% needed in buses, we adjust this to:
110 CLRVs + 3.4 buses compared to 100 buses
- OR -
113.9 CLRVs being compared to 100 buses
I haven’t even began to discuss why the streetcar fails in supplying capacity when it is actually operating, and we already need roughly 14 more of them. For 14 CLRVs at a replacement cost of $3 million, we could purchase 70 buses at $600 K!
Next installment - Part IIb - More on capacity
Monday, October 04, 2004
The 'MFP' Inquiry
In fact, the way the inquiry has been portrayed in the press - with, in my view, an overemphasis on the aggressive sales tactics used by MFP - may scare away potential bidders on request-for-proposals issued by the city. I'll grant that almost no-one in this city approves of Mr. Dash Domi's spare-no-expense sales approach. However, a salesman must adjust his sales approach to the rules, behaviours, and dynamics of his potential client's organization. It would be interesting to know whether MFP's competitors used similarly aggressive tactics in the initial bid process.
However, MFP's behaviour is not at the heart of the matter. They concluded a legal contract with the city. The inquiry was called to find out why and how the contract was extended in value and duration from the initial approved terms. All organizations of any size that enter into contracts to buy (or sell) goods and services have rules in place that cover what is generally called the 'delegation of authority'.
The delegation of authority is a set of guidelines on who in the organization must approve agreements. For example, a front-line departmental manager may have authority to approve purchase orders up to $5,000 - or enter into service agreements up to a certain value and duration. As the value and duration of agreements increase, the authority required to approve rises up the organizational ladder. In a private organization, contracts above the highest threshold will be subject to board approval, or even a to shareholder vote.
In the case of MFP's agreement with the city, surely the original audit must have been able to identify who was involved in somehow circumventing the City's rules on delegation of authority.
There is certainly value in examining how cultural factors within the City bureaucracy contributed to things going awry. There are severe organizational, and moreover cultural, problems in Toronto's City Hall. However, I question the $17 million price tag - and I'm doubtful that Mayor Miller and his cabal have the skills or inclination to tackle them.
I hope the learned judge presiding over this marathon will strongly emphasize the internal organizational and cultural problems. If not, these will get lost in the the glare.
Saturday, October 02, 2004
Analysis of TTC Streetcars - Part I
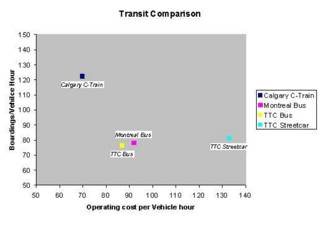
Chart comparing transit performance
With the TTC whining so much about $$$ (specifically the lack thereof) why are they running streetcars? The TTC claims better capacity - but their own figures (from a report prepared for the TTC by the IBI Consulting group in 2003) show otherwise.
TTC Streetcar achieved capacity in boarding's per hour is 81 / hour - compared to 76 / hour for the TTC's buses. However, the streetcar figure includes the larger streetcars (ALRVs) that the TTC operates predominately on Queen St.
If we adjust the 81 boardings / hour for the total fleet of streetcars - based on the numbers of each in the fleet, and the relative planning capacitys used by the TTC:
CLRVs:
Number in fleet: 196
Planning Capacity: 75
Weighted number of units: 174.36
Weighted achieved capacity: 73.7 Boardings / hour
ALRVs:
Number in fleet: 52
Planning Capacity: 110
Weighted number of units: 69.37
Weighted achieved capacity: 108.1 Boardings / hour
In others words, on a prorated basis at least, the TTC achieves better capacity from its standard 40 ft buses (76 / hour) - that with the larger, more expensive standard streetcar.
Next installment - Where does the capacity go?